Interpreting the Results


As a control the bats were initially flown down the hall without the presence
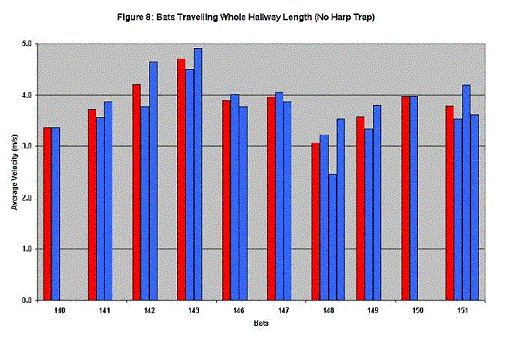
of the harp trap. Average velocities for flights down the entire length of
the hall are shown in Figure 8. Individual flights are plotted in blue. An
average of individual flights is shown in red. Average velocities ranged from
3.1-4.7m/s. While there is variation between bats, velocities for any one
bat are fairly similar.
Many of the flights conducted without the presence of the harp
trap did not cover the entire length of the hallway. Velocities for these abbreviated
flights ranged from 2.9-4.3m/s. These results are plotted along with the results
of Figure 8 in Figure 9. Long flights (i.e., 14.7m) are shown in blue. Shorter
flights (<14.7m) are shown in red. Velocities for shorter flights are only
slightly slower than those for the entire 14.7m.
The bats were then reflown down the hallway with the harp trap
located at 9.6m down the 14.7m hallway. Velocities for these flights are plotted
in Figure 10. Velocities ranged from 2.8-4.6 m/s. Four types of flights are
noted by color on the graph – red for bats that were conventionally trapped,
green for bats that were accidentally trapped, yellow for bats that flew through
the trap and blue for bats that avoided the trap.
Measured wing areas are plotted as a function of bat weight
in Figure 11. The graph shows that there is no significant relationship between
these two variables.
Velocities in the presence of the trap are plotted as a function of weight,
wing area and wing loading in Figures 12, 13 and 14, respectively. Again the
data points are color-coded – red for bats that were conventionally trapped,
green for bats that were accidentally trapped, yellow for bats that flew through
the trap and blue for bats that avoided the trap. None of the graphs show a
significant correlation. According to the hypothesis, bats with a lower wing
loading should be able to avoid the trap because they can fly at lower velocities
and are more maneuverable. Thus, one would expect the captured bats to be concentrated
in the upper right-hand corner of Figure 14. However, Figure 14 shows no such
correlation.